Catalina Marks 40th Anniversary By Sharing Long-term CPG Category Shifts
As part of its 40th anniversary celebration, shopper intelligence leader Catalina delved into the shifting preferences and category trends of the American consumer. Data shows the contents of U.S. grocery carts have transformed dramatically in the past four decades.
In response to the growing preference for health-conscious and flavor-forward choices, shelf space is now increasingly dedicated to bottled water, fiery hot sauces and salsas, and premium pasta sauces, according to Catalina’s Shopper Intelligence Platform.
“As consumer tastes change so does our ability to understand what motivates shoppers to buy new product categories while continuing to purchase category favorites,” said Wesley Bean, US Chief Revenue Officer. “Our purchase-based insights offer retailers and CPG brands the ability to precisely target consumers with relevant messaging that drives sales.”
US Preferences Have Evolved Since 1983: A Few Key Categories
While Catalina’s Shopping Basket Index shows inflation has had a significant short-term impact on the sales of categories such as eggs, cereal, and soft drinks, these four areas demonstrate how grocery cart staples have evolved since 1983, when the company was founded.
Bottled Water
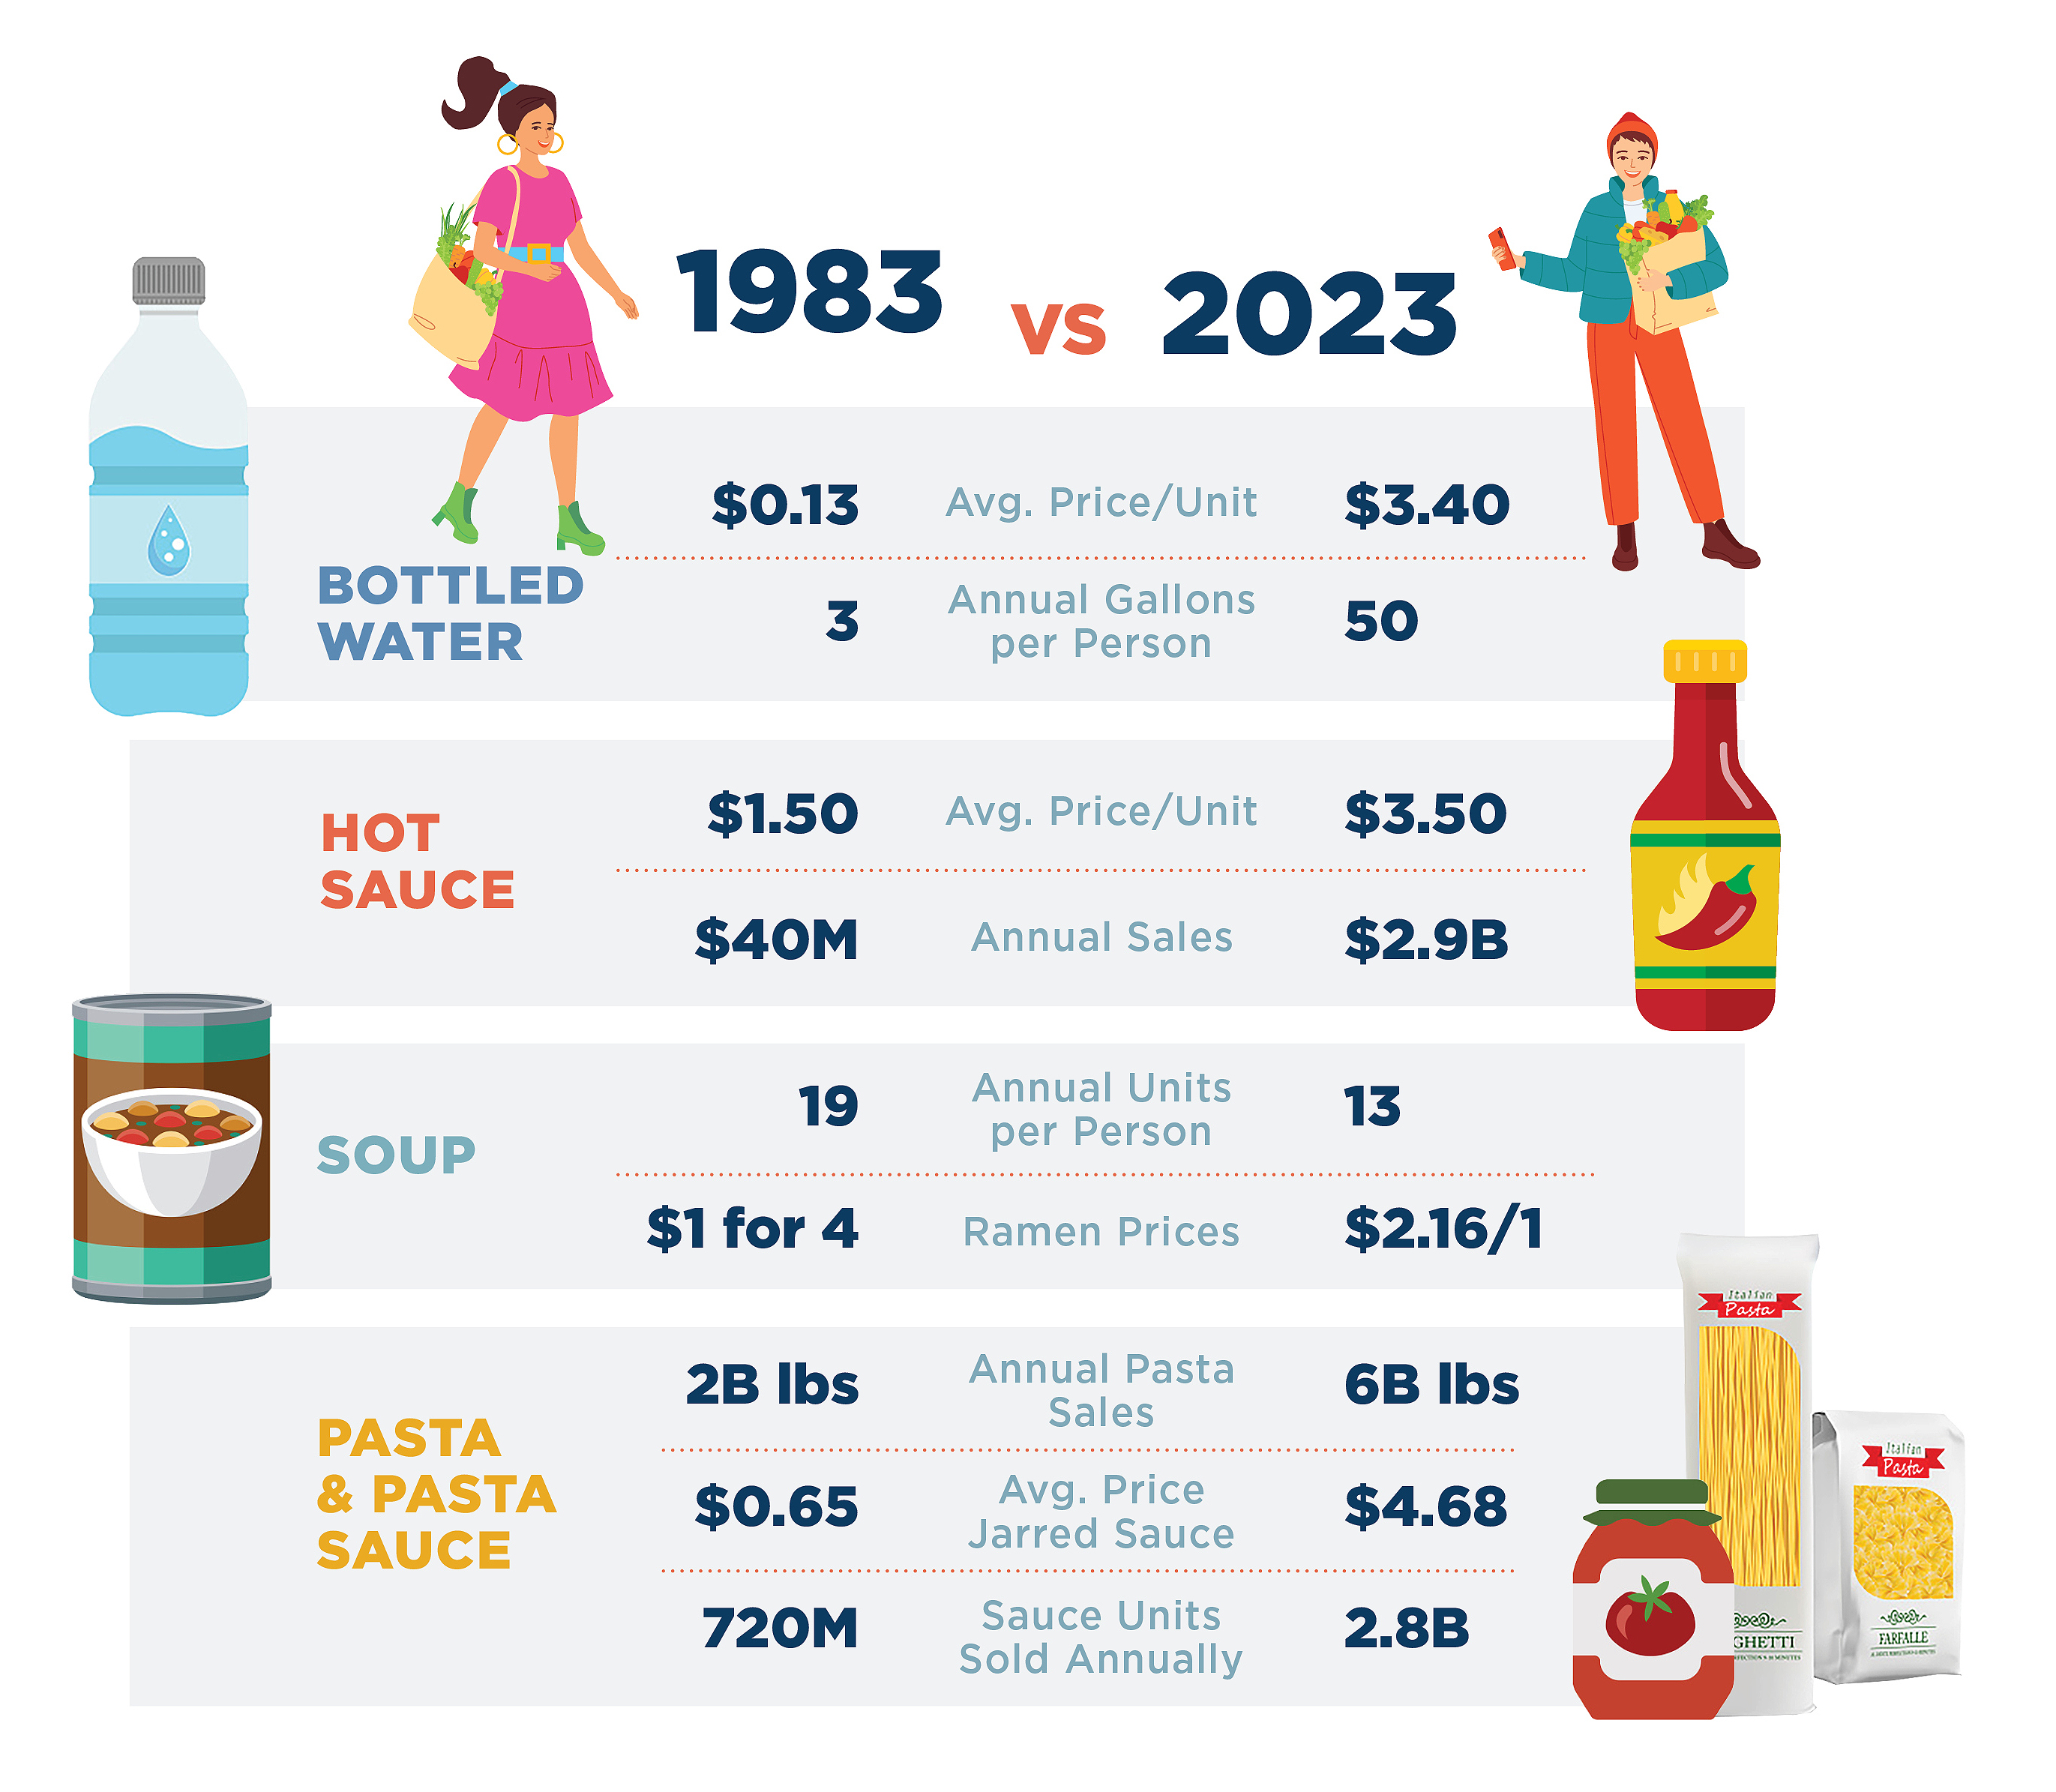
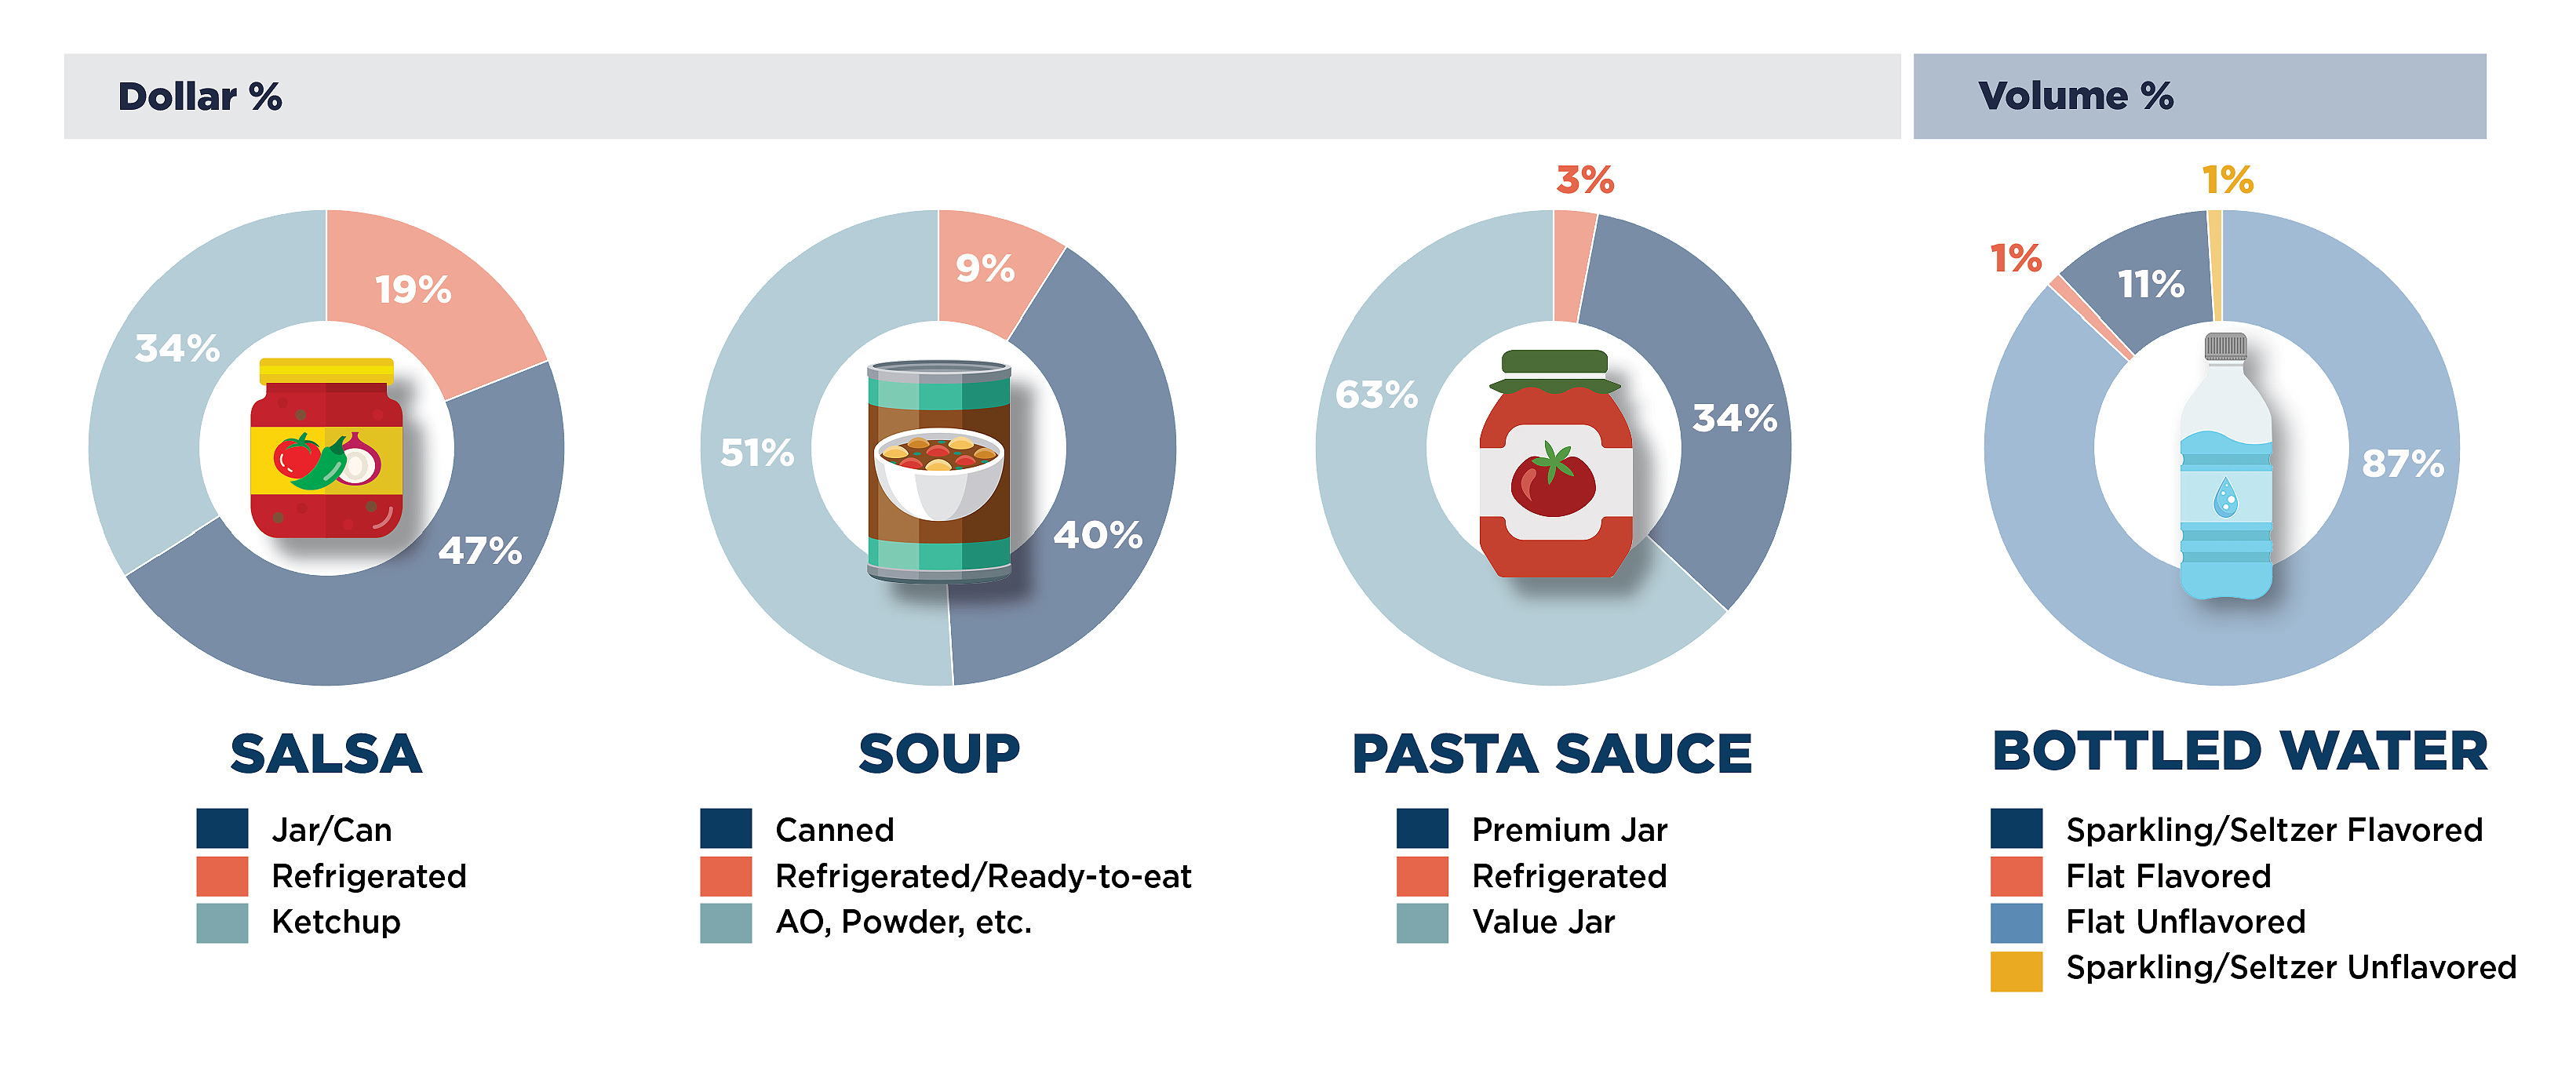
Categories such as Bottled Water have grown exponentially since 1983, with $100 billion in sales predicted for 2024†, with a projected growth rate of 6%. Unflavored water is the category leader, capturing 87% of the market today. The average American drank about three gallons of bottled water in 1983, compared with 50 gallons per person in 2023§. In 1983, the average price of a bottle of water at a grocery store cost $0.13, a fraction of today’s average price of $3.40 for flat water across of multiple sizes.
Salsa & Hot Sauce
Salsa has overtaken Ketchup as a condiment favorite, with shelf stable jars and cans of Salsa comprising 47% of sales, followed by Ketchup (34%) and Fresh Salsa (19%). Hot Sauce has grown from a $40 million category in the early 1980s to a $2.9 billion category in 2023♦. Consumers enjoy spicing up everything from eggs to pasta to tacos and gravitate toward branded products; only 13% of the more than 3,000 SKUs are private brands. The average hot sauce costs $3.50 today compared to about $1.50 in 1983.
Soup
Soup continues to be a shopping basket staple, with Powdered Soups accounting for 51% of sales and Refrigerated Soups for 9%, cutting into the Canned Soup (40%) category share in 2023. Shoppers may buy fewer cans than they did in the 1980s—down from 19 to 13 per year‡—but that’s been offset by the growing popularity of ramen and single-serve powdered soups. In 1983 college students could buy a 4-pack for $1.00; now shoppers can purchase only one unit at an average price of $2.16.
Pasta & Pasta Sauce
It’s been reported that Thomas Jefferson brought the first dried pasta in the form of macaroni to America. By 1983, Americans were consuming two billion pounds of pasta annually. Today, that figure has grown to six billion poundsº, equal to 20 pounds of pasta per person.±
This trend explains the parallel growth of pasta sauces over the last 40 years. When Catalina launched, there were only two major brands of pasta sauce and 720 million were sold. Now there are more than 5,000 SKUs and 2.8 billion jars¨ and cans sold annually, with Premium Pasta Sauce accounting for 43% of sales and 26% of units sold in 2023. In 1983, a jar of pasta sauce cost $0.65 while today prices range from $2.98 for Value Brands to $4.68 for Refrigerated Sauce.
Catalina offers real-time insights on CPG consumption trends
Since its launch in 1983, Catalina has consistently offered innovative, data-driven solutions to help retailers, brands and agencies understand and influence shopper behavior. Today, it offers real-time insights for nearly every household across in-store and digital channels, including Connected TV.
Catalina Can Help Grow Your Brand
Catalina’s 1:1 purchase insights on nearly all households will help you dig deep to understand, find, activate and optimize your marketing programs. We customize campaigns based on your objectives and budget. Check out some of our Success Stories to see how we’ve helped brands across several categories.
Understanding shopper behavior in real time helps us intelligently and dynamically deliver the right message across the right media most efficiently. If you’re looking to maximize product engagement and incremental sales, contact us today at results@catalina.com.
†Statista, US Bottled Water Market Insights (2024)
§Statista, US Bottled Water Market Insights (2024)
♦Fortune Business Insights, 2030 Trends Report and IBISWorld, US Salsa Market Growth
‡Canned Food Alliance, 2023 Canned Food Alliance and Statista, US Consumption of Canned Soup
ºUSA Today, Popular Types of Pasta (2023)
±National Pasta Association
¨Statista, Usage of Pasta Sauce, 2011-24